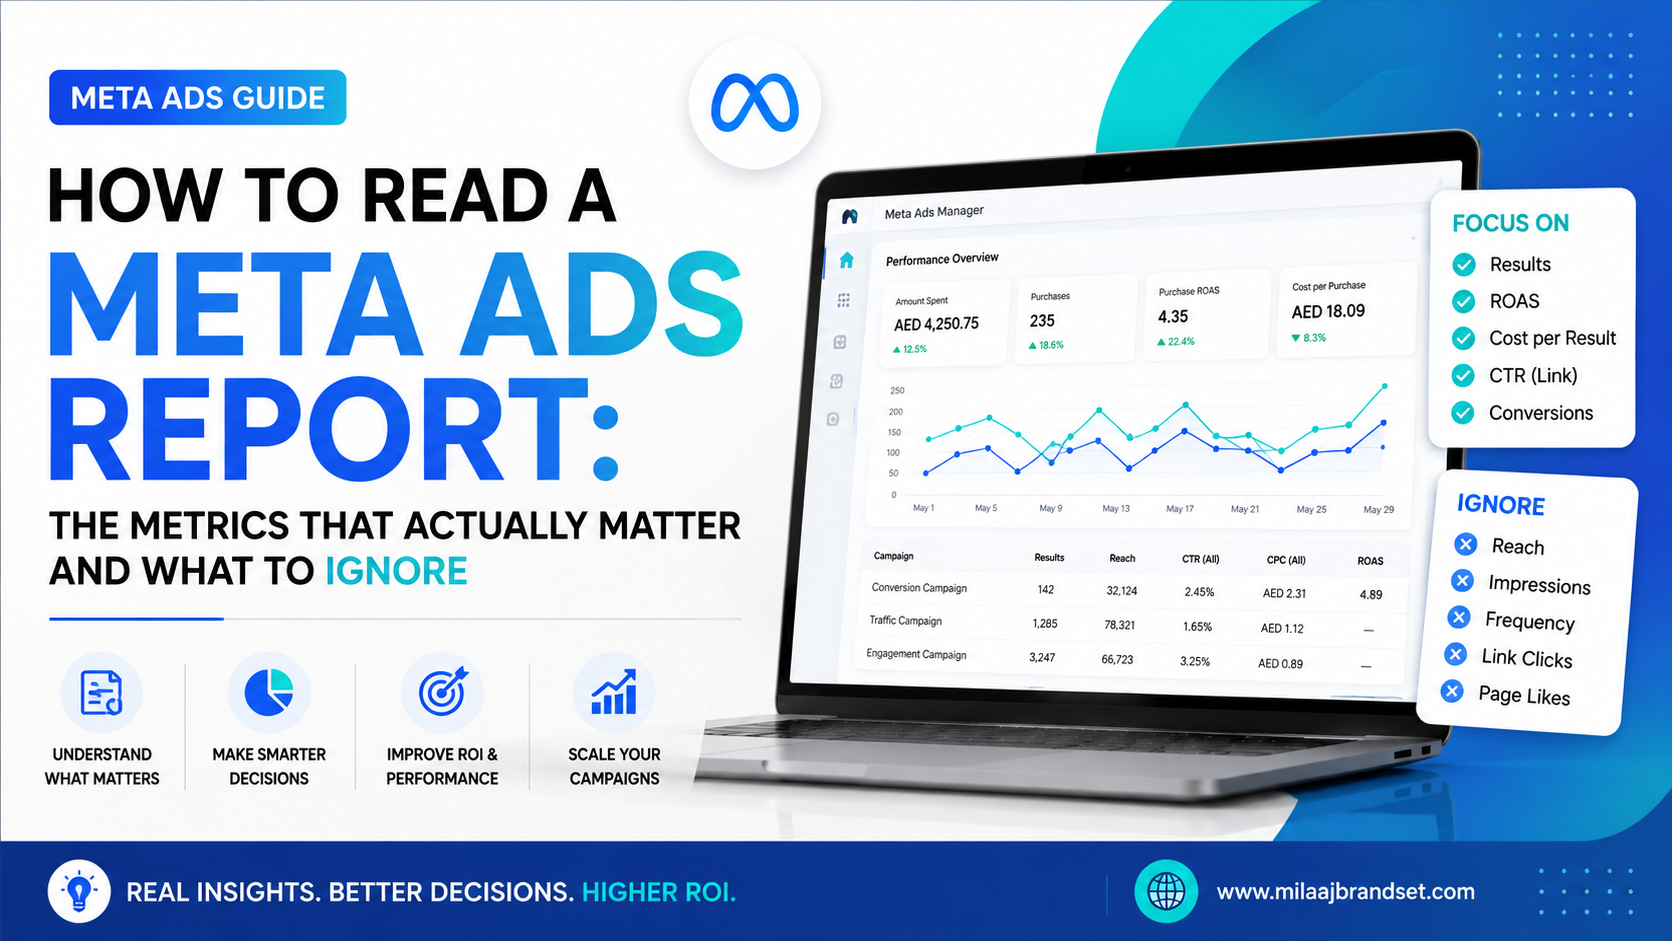
Opening your Meta Ads Manager dashboard on a Monday morning can feel like looking at a wall of flying numbers.
With dozens of columns stretching across your screen ranging from impressions, reach, and link clicks to quality rankings, cost per outcome, and video play percentages it is easy to lose sight of a basic question: Is this campaign actually making money?
Many business owners and beginner marketers fall into the "scoreboard trap." They scan surface-level numbers, panic over rising costs per click, or celebrate high engagement rates on ads that generated zero sales.
In 2026, with Meta’s Advantage+ campaigns handling audience selection and placement bidding automatically through machine learning, knowing how to read a Meta Ads report comes down to distinguishing diagnostic signals from meaningless noise.
This guide reveals which metrics deserve your daily attention, how to spot performance bottlenecks before wasting ad spend, and which vanity metrics you should ignore.
The Meta Ads Reporting Trap: Scoreboard vs. Diagnostic Mindset
The primary reason media buyers misinterpret their performance data is that they view Ads Manager as a simple scoreboard.
When ROAS looks good, they feel winning; when ROAS drops, they frantically toggle off ad sets without understanding why performance shifted.
[ Traditional View ] ➔ Look at ROAS/CPA ➔ Panic & Turn Off Ads[ Expert View ] ➔ Analyze Funnel Metrics ➔ Identify Bottleneck ➔ Optimize Creative or Landing Page
A Meta Ads report is a diagnostic system. Every column tells a story about a specific step in your customer’s journey:
- Ad Quality & Hook: Did the visual grab their attention in the feed?
- Ad Message & Offer: Did the copy compel them to leave Meta and visit your site?
- Landing Page Experience: Did your website deliver on the ad's promise and convert the visitor?
If you treat every metric as an isolated score, you miss the systemic cause behind poor returns.
The Core Metrics That Actually Matter (Bottom-Line KPIs)
When evaluating campaign health, start at the bottom of your conversion funnel. These primary business metrics tell you if your ads are delivering profit.
1. Cost Per Acquisition (CPA) / Cost Per Lead (CPL)
- What it measures: The exact amount of ad spend required to generate a single conversion, sale, or lead form submission.
- Why it matters: CPA directly dictates your profit margins. If your average customer lifetime value or gross profit margin on a product is $50, and your Meta CPA is $35, your campaign operates profitably. If CPA climbs to $60, you lose money on every unit sold—regardless of how good your click-through rates look.
2. Return on Ad Spend (ROAS)
- What it measures: Total revenue generated divided by total ad spend.
- Formula:$$\text{ROAS} = \frac{\text{Total Ad Revenue}}{\text{Total Ad Spend}}$$
- Why it matters: ROAS provides an immediate efficiency ratio for e-commerce brands. However, always calculate your break-even ROAS before setting goals. A 2.5x ROAS might be wildly profitable for a digital product with 90% margins, but bankrupt a retail business with 20% product margins.
3. Outbound Click-Through Rate (Outbound CTR)
- What it measures: The percentage of ad impressions that resulted in a click leading users off Meta's platform onto your destination URL.
- Why it matters: Standard CTR (All) includes likes, comment expansions, profile visits, and image clicks. Outbound CTR isolates visitors who took action to visit your website.
- Benchmark: Aim for an Outbound CTR above 1.0% to 1.5%. Anything below 0.8% indicates a creative or audience relevance mismatch.
4. Landing Page View (LPV) Conversion Rate
- What it measures: The ratio of users who successfully load your landing page compared to those who click your ad.
- Why it matters: A heavy drop-off between Outbound Clicks and Landing Page Views points to slow site speed, broken redirect links, or mobile rendering errors. If 100 people click your ad but only 50 land on your site, you lose half your potential buyers before they read your offer.
Mastering these analytical frameworks is essential for modern growth teams. Developing practical expertise through an immersive AI-powered digital marketing course ensures you can set up pixel attributions, read complex reporting dashboards, and build data-driven media plans.
Creative Diagnostic Metrics: How to Fix Performance Bottlenecks
When your CPA rises or ROAS drops, you need to understand why. Creative diagnostic metrics help you isolate the precise point of friction in your video or visual ad assets.
Diagnostic Metric | Calculation / Definition | Strategic Insight |
Hook Rate | $\text{(3-Sec Video Views} \div \text{Impressions)} \times 100$ | Evaluates the first 3 seconds of your video. If under 25%, your opening visual fails to stop the scroll. |
Hold Rate | $\text{(ThruPlays} \div \text{3-Sec Video Views)} \times 100$ | Evaluates message delivery. If Hook Rate is high but Hold Rate drops fast, your hook was misleading or the middle content dragged. |
CPM (Cost Per 1,000 Impressions) | $\text{(Total Spend} \div \text{Impressions)} \times 1,000$ | Shows auction competition and ad quality scoring. High CPMs mean Meta penalizes low-quality creatives or targets congested audiences. |
Creative Fatigue Score | Meta's automated fatigue indicator based on repetition and declining CTR. | Signals that your target audience has seen the ad too many times and requires new creative angles. |
By systematically isolating Hook Rate, Hold Rate, and Landing Page conversion rates, media buyers solve problems logically instead of guessing.
Vanity Metrics to Ignore (Or Handle With Caution)
When reviewing a Meta Ads report, certain metrics look impressive on paper but rarely correlate with business profit.
1. Clicks (All) & CTR (All)
Meta defines "Clicks (All)" as any interaction with your ad card—including clicking "See More" on text, pausing a video, clicking a profile picture, or liking a comment.
A campaign can show a 4.5% CTR (All) while sitting at a dismal 0.3% Outbound CTR. Never evaluate ad success based on Clicks (All). Always filter your reporting columns by Outbound Clicks.
2. Raw Impressions and Reach
While reach shows total unique people exposed to your ad, raw reach numbers without conversion context mean little. Showing an ad to 500,000 people yields zero enterprise value if none take action. Use reach solely to evaluate audience saturation and frequency capping.
3. Estimated Ad Recall Lift
Meta calculates Estimated Ad Recall Lift through predictive polling algorithms estimating how many users might remember seeing an ad within two days. Unless running multi-million dollar brand awareness campaigns for corporate enterprise entities, focus on concrete conversion outcomes like leads, calls, and purchases.
Step-by-Step: How to Customize Your Meta Ads Manager Columns
To analyze campaigns effectively, build a customized reporting view inside Meta Ads Manager.
1. Open Ads Manager ➔ 2. Click Columns Dropdown ➔ 3. Select 'Customize Columns' ➔ 4. Save Preset
Essential Column Sequence for Daily Analysis
Arrange your reporting columns in chronological order following the user experience journey:
- Campaign Name / Ad Set / Ad Title
- Amount Spent
- Impressions / Reach
- Frequency
- CPM (Cost Per 1,000 Impressions)
- Hook Rate (3-Sec Views ÷ Impressions)
- Outbound CTR
- Cost Per Outbound Click
- Landing Page Views
- Purchases / Leads (Results)
- Cost Per Result (CPA / CPL)
- ROAS (Purchase Return on Ad Spend)
Save this custom configuration as your default preset (e.g., "Funnel Diagnosis View"). Scanning your data from left to right lets you trace customer drop-off across your entire funnel in seconds.
Building sustainable marketing pipelines requires combining paid channels with long-term organic strategies. Expanding your expertise across technical search engine optimization and analytics through comprehensive digital marketing programs ensures balanced customer acquisition channels.
Frequently Asked Questions (FAQs)
What is the single most important metric in a Meta Ads report?
The most critical metric depends on your campaign objective. For performance campaigns (e-commerce or lead generation), Cost Per Acquisition (CPA) or Cost Per Lead (CPL) combined with ROAS are the primary indicators of business profitability.
What is a good Hook Rate for video ads on Meta?
A strong Hook Rate (3-second video views divided by impressions) generally sits above 25% to 30%. If your Hook Rate drops below 20%, test new visual hooks, dynamic text overlays, or native pattern-interrupt openings.
Why are my Meta Ads conversion numbers different from Google Analytics?
Discrepancies occur due to different attribution models and privacy frameworks. Meta defaults to a 7-day click / 1-day view attribution window, whereas Google Analytics typically uses last-click or data-driven attribution models. Implementing server-side conversion tracking (Conversions API) helps reduce data gaps.
How often should I check my Meta Ads report?
Avoid over-analyzing data on a daily basis for active campaigns, as machine-learning models require time to optimize. Review high-level spend daily to catch anomalies, but make creative or budget optimizations based on 3-day, 7-day, or 14-day rolling averages.
Final Thoughts: Reading Data to Drive Profitable Decisions
Learning how to read a Meta Ads report transforms paid advertising from a high-stakes guessing game into a predictable growth engine.
Instead of getting distracted by vanity engagement or surface-level clicks, focus your focus on bottom-line business metrics like CPA, CPL, and ROAS. Use creative diagnostic signals like Hook Rate, Outbound CTR, and Landing Page conversion rates to pinpoint bottlenecks whenever performance dips.
By customizing your Ads Manager dashboard and reading your performance metrics as an interconnected system, you can eliminate wasted ad spend, scale winning creatives, and consistently drive profitable customer growth.