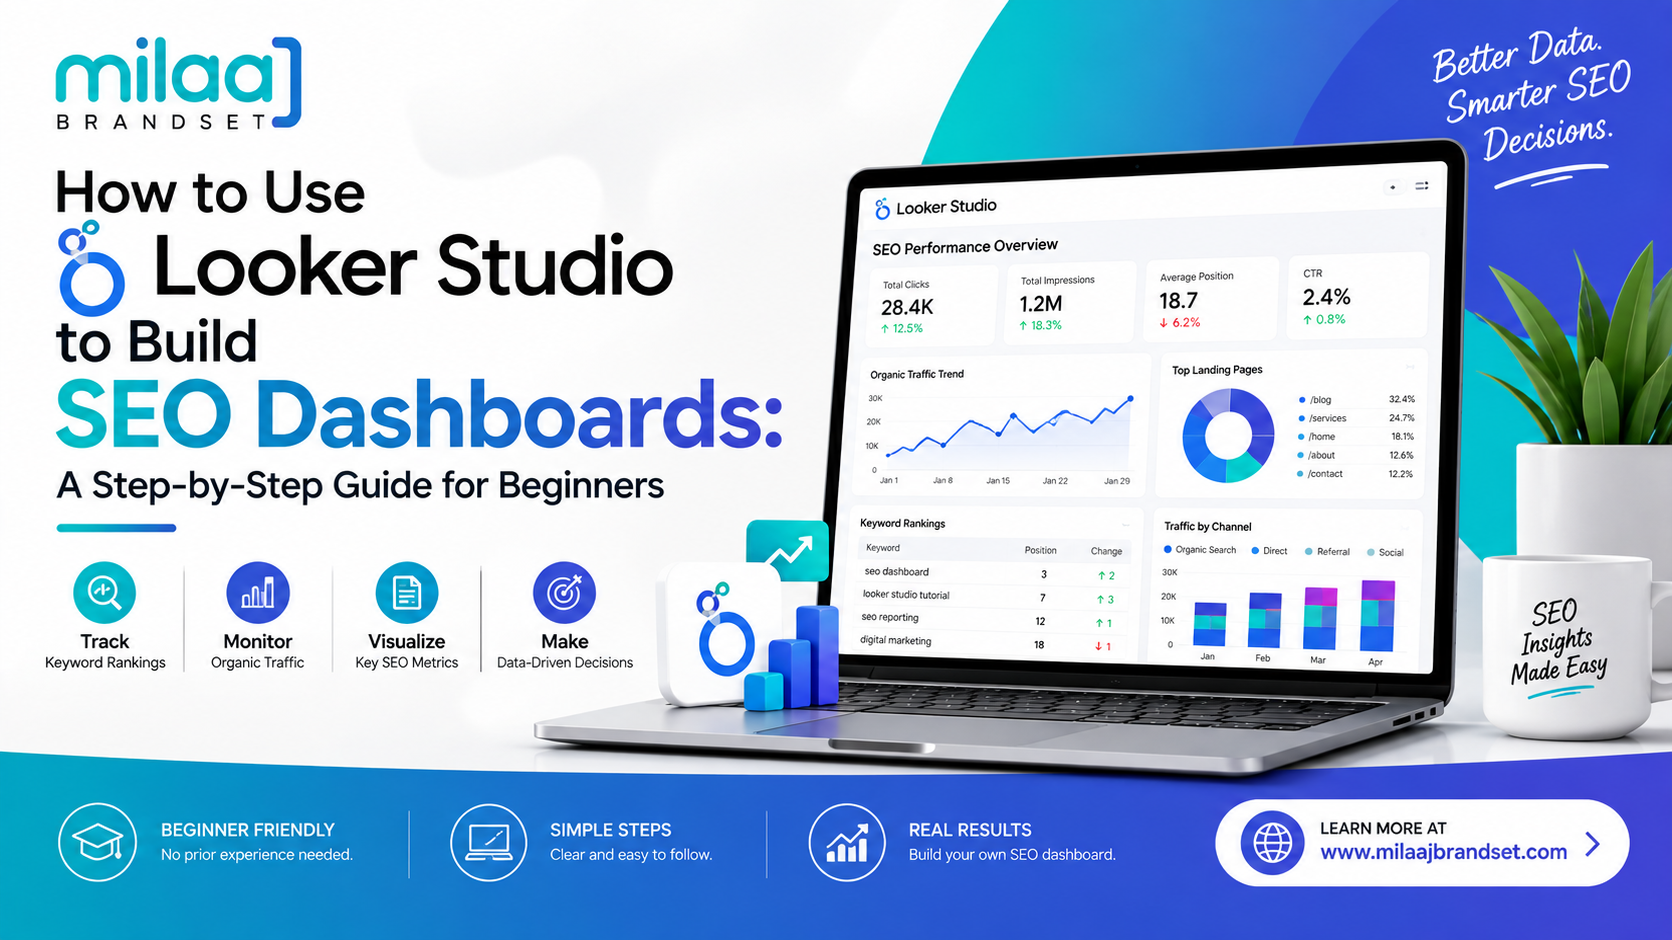
Tracking organic growth across multiple platforms often feels overwhelming. Gathering metrics from Google Search Console, Google Analytics 4 (GA4), and rank trackers requires logging into several tools and manually updating spreadsheets.
Looker Studio (formerly Google Data Studio) simplifies this process.
Looker Studio connects directly to your search platforms, automates data collection, and turns complex search metrics into clean, interactive visuals.
Whether you manage internal site metrics or present monthly performance updates to clients, learning how to use Looker Studio to build SEO dashboards saves hours of manual work.
This step-by-step guide walks you through setting up your first automated SEO dashboard from scratch.
Why Looker Studio Is Essential for Modern SEO Reporting
Before diving into the setup process, it helps to understand why digital marketers favor Looker Studio over default platform interfaces.
- Centralized Data Integration: Connect Google Search Console, GA4, Google Sheets, and third-party SEO platforms into a single reporting view.
- Real-Time Data Refreshing: Say goodbye to manually exporting CSV files. Looker Studio updates its charts automatically as new search data comes in.
- Customizable Interactive Filters: Allow users to filter performance metrics by date range, device type, geographic location, or specific URL subfolders.
[ MANUAL vs. AUTOMATED REPORTING ] [ Old Way ] ➔ Log into 3 Tools ➔ Export CSVs ➔ Update Sheets ➔ 4 Hours Lost [ New Way ] ➔ Open Looker Studio ➔ Live Data Refreshes ➔ 100% Automated
Step 1: Connect Your Core SEO Data Sources
To start, navigate to Looker Studio and sign in using your Google account. Click + Create in the top-left corner and select Report.
[ Looker Studio ] ➔ Select "Create Blank Report" │ ┌─────────────────────┴─────────────────────┐ ▼ ▼ [ Google Search Console ] [ Google Analytics 4 ] - Direct Impressions - Organic Sessions - Organic Clicks - Key Event Conversions - Average Position - Engagement Rate
1. Connect Google Search Console (GSC)
GSC provides reliable search visibility metrics (impressions, clicks, and keyword rankings).
- In the "Add data to report" panel, search for Google Search Console.
- Select your verified website property.
- Choose the URL Impression table (for page-level data) or Site Impression table (for overall site metrics).
- Select Web as the search type and click Add.
2. Connect Google Analytics 4 (GA4)
GA4 tracks post-click user behavior and conversions resulting from organic search.
- Click Add data from the top menu toolbar.
- Select the Google Analytics connector.
- Choose your account and target GA4 property, then click Add.
Step 2: Set Up Core Executive Scorecards
Scorecards present high-level KPIs at a glance, making them ideal for the top section of your dashboard.
+-------------------------------------------------------------------------+| EXECUTIVE KPI SCORECARD ARRAY |+-------------------------------------------------------------------------+| TOTAL CLICKS | IMPRESSIONS | AVG. CTR | AVG. POSITION|| 24.5K (▲ 12%) | 480K (▲ 18%) | 5.1% (▲ 0.4%) | 14.2 (▲ 1.8) |+-------------------------------------------------------------------------+
- Click Add a chart in the top toolbar and select Scorecard.
- Drag the scorecard element onto your canvas.
- In the right-hand Data panel, set the data source to your GSC connection.
- Set the Metric to Clicks.
- Repeat this process to create scorecards for Impressions, Average CTR, and Average Position.
- In the Comparison date range section, select Advanced or Previous period to display auto-calculated growth percentages.
Step 3: Visualize Organic Performance Trends Over Time
A line chart (Time Series) shows how your organic search traffic fluctuates over days, weeks, or months.
[ TIME SERIES TRAFFIC OVER TIME CHART ] Clicks ▲ *--- High Traffic Peak │ *---* │ *---*---* │ *---*---* └─*───*───*───┴───────┴───────┴───────┴───────┴───────► Date Jan 1 Jan 15 Feb 1 Feb 15 Mar 1
- Click Add a chart and select Time series chart.
- Set the Dimension to Date.
- Set the Metrics to Clicks (from GSC) or Sessions filtered by Organic Search (from GA4).
- Switch to the Style tab to customize line colors, add smooth curves, and display data points.
To gain practical experience with analytics tools, technical audits, and performance tracking, enrolling in a comprehensive digital marketing course provides real-world training across campaign analytics, search strategies, and client reporting workflows.
Step 4: Build Top Landing Pages and Query Tables
To evaluate which pages drive organic performance, build structured tables to identify high-performing content.
- Select Add a chart and choose Table.
- Set the Dimension to Landing Page.
- Add Clicks, Impressions, and CTR as Metrics.
- Create a second table setting the Dimension to Query to display the top search terms driving users to your site.
Mastering calculated fields, multi-source data blending, and custom search filters helps you turn raw data into actionable SEO strategies. Taking a dedicated advanced SEO course equips you with advanced technical reporting skills designed for modern agency and in-house environments.
Step 5: Add Interactive Controls and Global Filters
Interactive controls let stakeholders customize date ranges and view specific subsets of data without modifying the underlying report layout.
[ Date Control: Last 30 Days ▼ ] [ Country Filter: India ▼ ] [ Device: Mobile ▼ ]
- Date Range Control: Click Add a control ➔ Date range control. Place it in the top header section of your report.
- Drop-Down List Controls: Click Add a control ➔ Drop-down list. Set the dimension field to Device Category or Country to let users filter performance dynamically.
4 Design Best Practices for Clear SEO Dashboards
To make your SEO reports easy to read and understand, follow these design principles:
- Group Related Data Logically: Organize metrics into clear sections (e.g., Executive Summary ➔ Traffic Acquisition ➔ Keyword Performance ➔ Conversion Results).
- Use Color Intentionally: Reserve bright accent colors to highlight key metrics, positive growth trends, or performance bottlenecks.
- Avoid Dashboard Clutter: Limit each report page to 6–8 core visual elements.
- Add Explanatory Notes: Place short text boxes below complex charts to explain what the data shows and highlight key actions.
Looker Studio SEO Dashboard Matrix
Use this layout framework to structure your custom SEO dashboard:
Dashboard Section | Recommended Visual | Data Source | Primary Metrics / Dimensions |
Top Header Bar | Date & Drop-down Filters | GSC / GA4 | Date Range, Device, Country |
KPI Summary | Scorecards Array | Search Console | Clicks, Impressions, CTR, Position |
Performance Trend | Time Series Line Chart | GA4 / GSC | Date (Dimension) vs Organic Sessions |
Keyword Insights | Structured Data Table | Search Console | Query (Dimension) vs Clicks & CTR |
Page Analytics | Structured Data Table | GA4 / GSC | Landing Page (Dimension) vs Conversions |
Frequently Asked Questions (FAQs)
Is Looker Studio completely free to use?
Yes, Looker Studio is a free data visualization platform provided by Google. Connecting native Google connectors—such as Google Search Console, Google Analytics 4, and Google Sheets—involves zero software costs.
Can I combine Search Console and GA4 data in a single chart?
Yes, using Looker Studio's Data Blending feature. You can combine GSC data (clicks and impressions) with GA4 data (organic sessions and conversions) by joining both datasets on a common field, such as Landing Page.
How do I share my completed Looker Studio dashboard with clients?
Click the Share button in the top-right corner. You can grant direct view/edit access via email, generate a shareable link, set up automated PDF email deliveries on a schedule, or embed the dashboard directly into a web page.
Conclusion: Automate Your SEO Reporting Workflow
Learning how to use Looker Studio to build SEO dashboards turns complex, scattered metrics into clear, actionable insights. By connecting your core data sources, setting up executive scorecards, and adding interactive date controls, you create an automated reporting system that saves time and keeps your team aligned on growth.
Connect your Google Search Console property today, build your first scorecards, and streamline your reporting workflow.